Comet Embedding Projector
Embedding Visualization
The word "embedding" has been used in a variety of ways in Machine Learning. Here, we will mean something very general: a "vector" representation of a category, where category can really be anything---a number, string, label, or description. We'll call that a "label".
Our main goal is the ability to visualize each of these vectors in a 2D or 3D plot, where each vector is a point in the space, and each of those points is associated with its label. Here is such an example showing a high-dimensional mapping of the MNIST digit vector representation (28 x 28) being mapped to 3D as determined by Principal Component Analysis (PCA) and showing an image at each point based on the associated label:
In the above image note that the color of each vector image has been color coded so that all digit pictures are associated with a unique color. We'll see how to do easily do that below.
In NLP processing, an embedding layer (and its associated output vector) is often a representation that has been reduced in dimensions. However, for our uses here it does not matter if the embedding is of 3 dimensions, or 1,000 (or more). For dimensions higher than three, we will use a dimensionality reduction algorithm (such as PCA, UMAP, or T-SNE) to visualize in 3D.
Logging Embeddings
The simplest method of creating and logging an embedding is just to pass Experiment.log_embedding() a list of vectors (e.g., a matrix, with one row for each item), and a list/array of labels (one number or string per item).
python
experiment.log_embedding(vectors, labels)
For example, consider this simple example of four points in four dimensions:
```python from comet_ml import Experiment
experiment = Experiment()
vectors = [ [1, 0, 0, 0], [0, 1, 0, 0], [0, 0, 1, 0], [0, 0, 0, 1], ] labels = ["one", "two", "three", "four"]
experiment.log_embedding(vectors, labels) ```
When you run this script, on the assets tab, you should see something similar to:
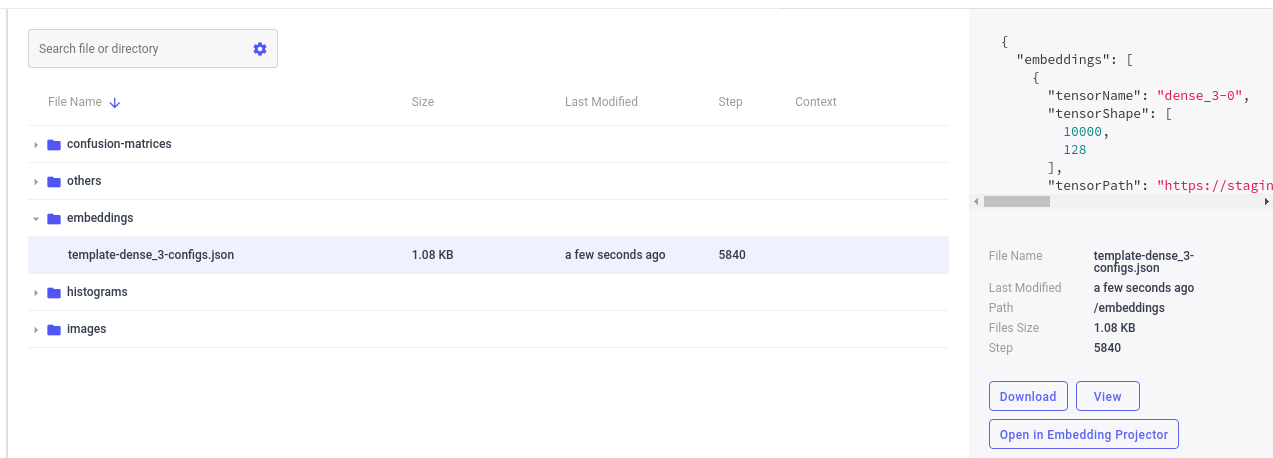
By using the Embedding Projector Panel (available under Public Panels in the Panels Gallery) or by selecting Open in the Assets Tab next to the embedding template name, you can then launch the Embedding Projector:
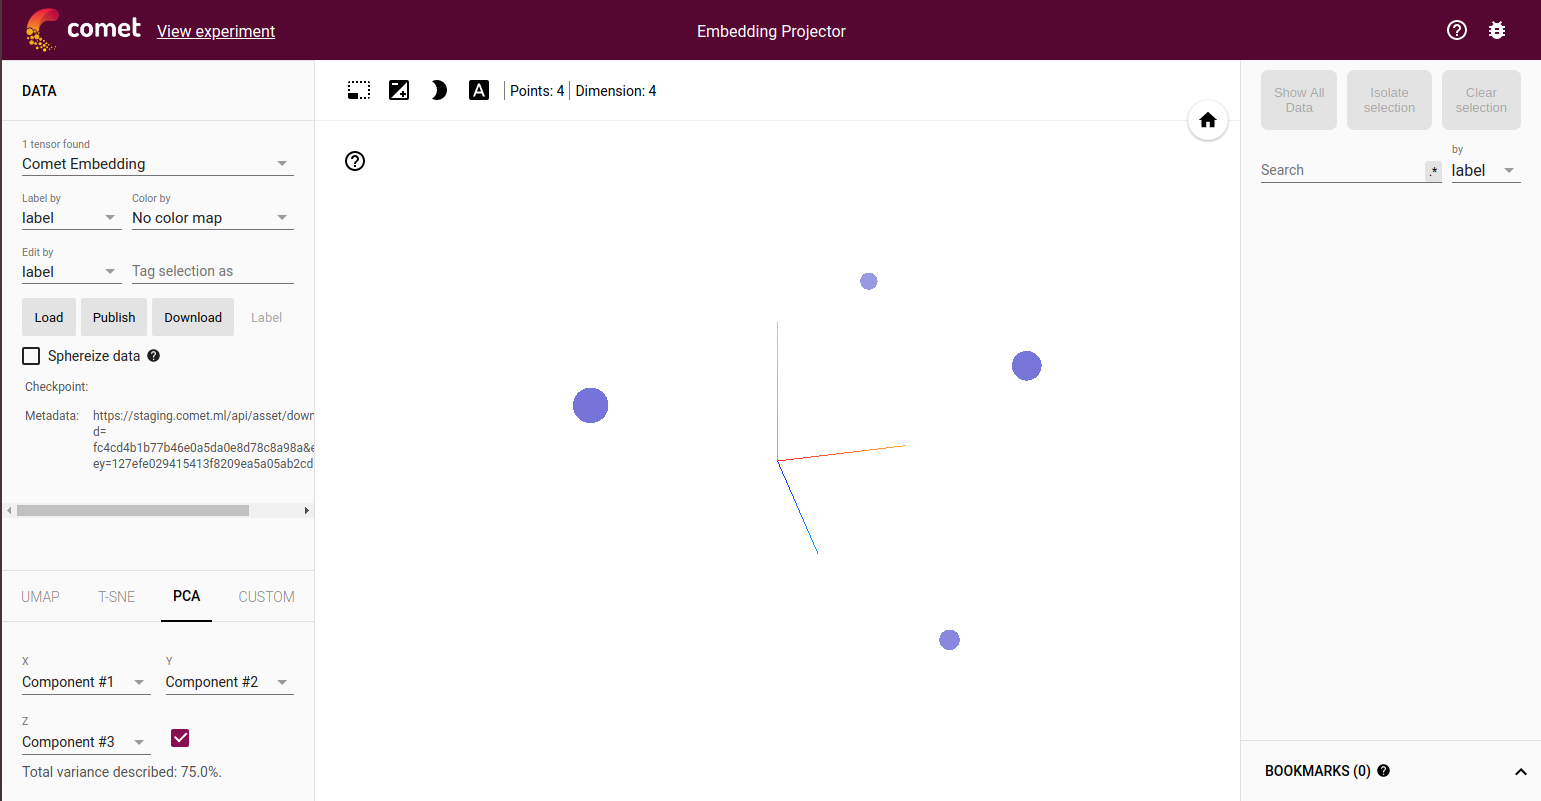
These are the four points shown in three dimensions.
Groups of Embeddings
You can include more than one visualization in each logged embedding by including a group name, and a title (so that you can easily distinguish among the different embeddings). Consider:
python
for epoch in range(max_epoch):
    model.train()
    experiment.log_embedding(vectors, labels,
        title="epoch-%s" % epoch,
    group="hidden-layer-1")
Here you can see how to log the embeddings that could be output activations from a particular hidden layer.
Embedding Images
Each embedding can also include a set of pictures, one for each representing each vector. You can either create the images automatically for each logged embedding:
python
experiment.log_embedding(
    vectors,
    labels,
    image_data,
    image_size)
For example, to continue with the above example, we make little 2x2 images for each vector:
```python image_data = [ [[255, 0], [0, 0]], [[0, 255], [0, 0]], [[0, 0], [255, 0]], [[0, 0], [0, 255]], ] image_size = (2, 2)
Log the images with the vectors:
experiment.log_embedding( vectors, labels, image_data, image_size) ```
Or, you can create the images once and use the resulting image_url wherever
image_data is used:
python
image, image_url = experiment.create_embedding_image(image_data, image_size)
For example, the image_url can be used as the image_data in
subsequent loggings, like:
python
experiment.log_embedding(
    vectors,
    labels,
    image_data=image_url,
    image_size=image_size)
Advanced Embedding Image Options
You can supply the following three options when creating an embedding image:
- image_preprocess_function: if image_data is an array, apply this function to each element first (numpy functions ok)
- image_transparent_color: a (red, green, blue) tuple that indicates the color to be transparent
- image_background_color_function: a function that takes an index, and returns a (red, green, blue) color tuple to be used as background color
For instance, consider the standard MNIST dataset represented as
```python from keras.datasets import mnist import numpy as np
def get_dataset(): num_classes = 10
# the data, shuffled and split between train and test sets
(x_train, y_train), (x_test, y_test) = mnist.load_data()

x_train = x_train.reshape(60000, 784)
x_test = x_test.reshape(10000, 784)
x_train = x_train.astype("float32")
x_test = x_test.astype("float32")
x_train /= 255
x_test /= 255
print(x_train.shape[0], "train samples")
print(x_test.shape[0], "test samples")

# convert class vectors to binary class matrices
y_train = keras.utils.to_categorical(y_train, num_classes)
y_test = keras.utils.to_categorical(y_test, num_classes)

return x_train, y_train, x_test, y_test
x_train, y_train, x_test, y_test = get_dataset()
def label_to_color(index): label = labels[index] if label == 0: return (255, 0, 0) elif label == 1: return (0, 255, 0) elif label == 2: return (0, 0, 255) elif label == 3: return (255, 255, 0) elif label == 4: return (0, 255, 255) elif label == 5: return (128, 128, 0) elif label == 6: return (0, 128, 128) elif label == 7: return (128, 0, 128) elif label == 8: return (255, 0, 255) elif label == 9: return (255, 255, 255)
image_data = x_test labels = y_test image_size = (28, 28)
And use the optional arguments:
image, image_ = experiment.create_embedding_image( image_data, image_size, # we round the pixels to 0 and 1, and multiple by 2 # to keep the non-zero colors dark (if they were 1, they # would get distributed between 0 and 255): image_preprocess_function=lambda matrix: np.round(matrix, 0) * 2, # Set the transparent color: image_transparent_color=(0, 0, 0), # Fill in the transparent color with a background color: image_background_color_function=label_to_color, ) ```
That will create this image which can then use for all of the embeddings with these labels:
![]()
References
For additional information, please see the following: