Reports
Overview
Comet Reports allow you to create a customized analysis of a set of experiments in a Comet Project. A report is composed of any number of sections composed of:
- Heading and markdown text
- Comet Panels
- Experiment Table for filtering and Selection
- Summary and markdown text
By adding any number of sections, you can create a complete analysis over the entire process. In addition, you can save these Reports and re-use them in other projects.
For a collection of good reads from great minds, see Comet's Report Library.
Reports
Each Comet Report belongs to a Project, and can be seen at the top of the view when in the Project View, or when viewing an individual Experiment in a Project:

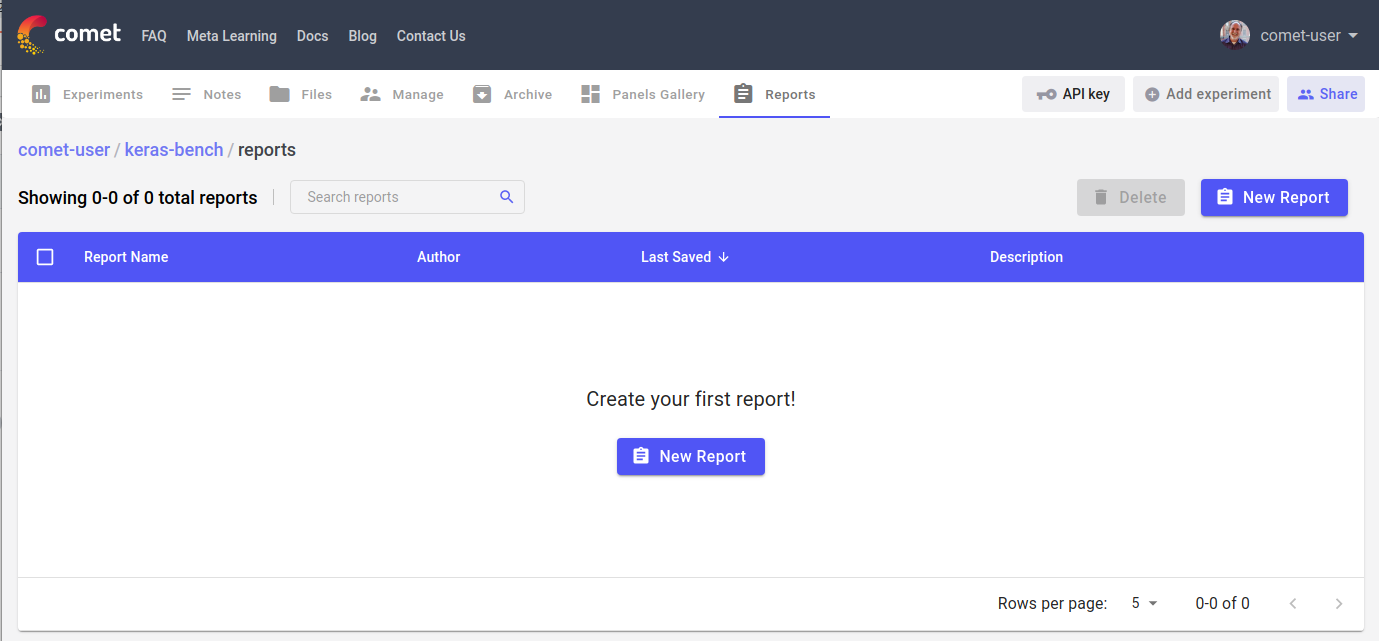
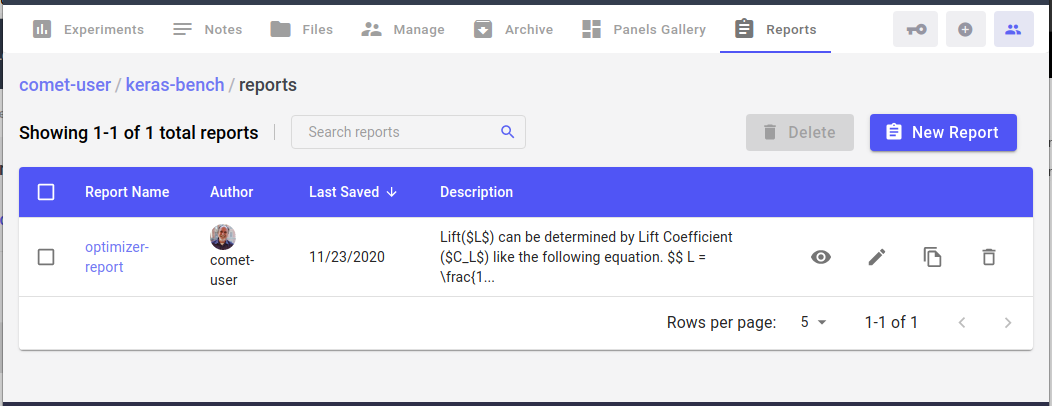
By clicking the Reports link at the top of the page, you will initially see an empty list or Reports, and a "New Report" button:
Clicking the "New Report" button will create a blank report:
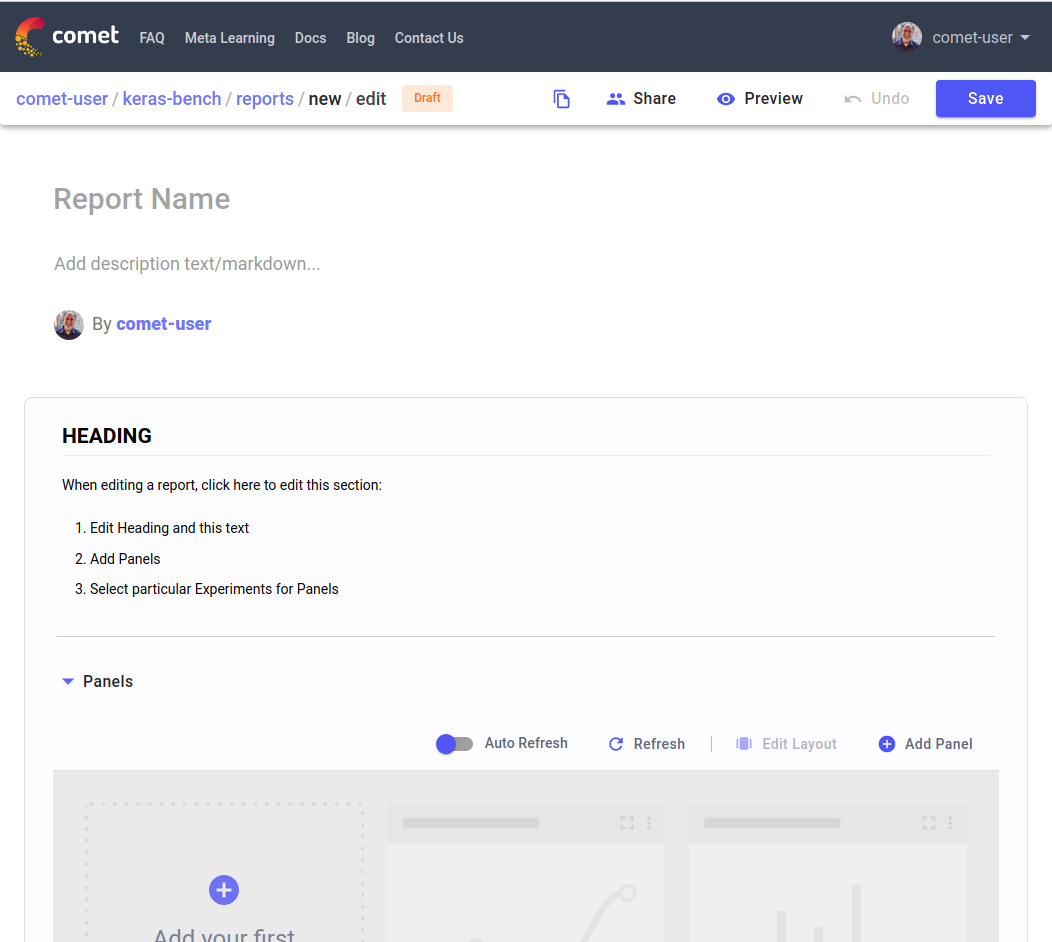
Each Comet Report begins with:
- Report Name
- Description
- By-line
The Report Name is required, and is unique among all of your reports, and so should be descriptive. The Description can include any supported markdown text, including lists, tables, links, but also code blocks, and LaTeX mathematical experessions. We explore the markdown format below.
After giving your report a unique name and description, you can then begin to edit the initial Section already included below the by-line. For many reports, you may only need a single Section. We'll discuss editing the Section below.
Sections
As mentioned, your new report is populated by a default Section. Each section is composed of the following parts:
- Section Heading and Markdown
- Panels
- Experiment Table (for filtering and selecting)
- Markdown
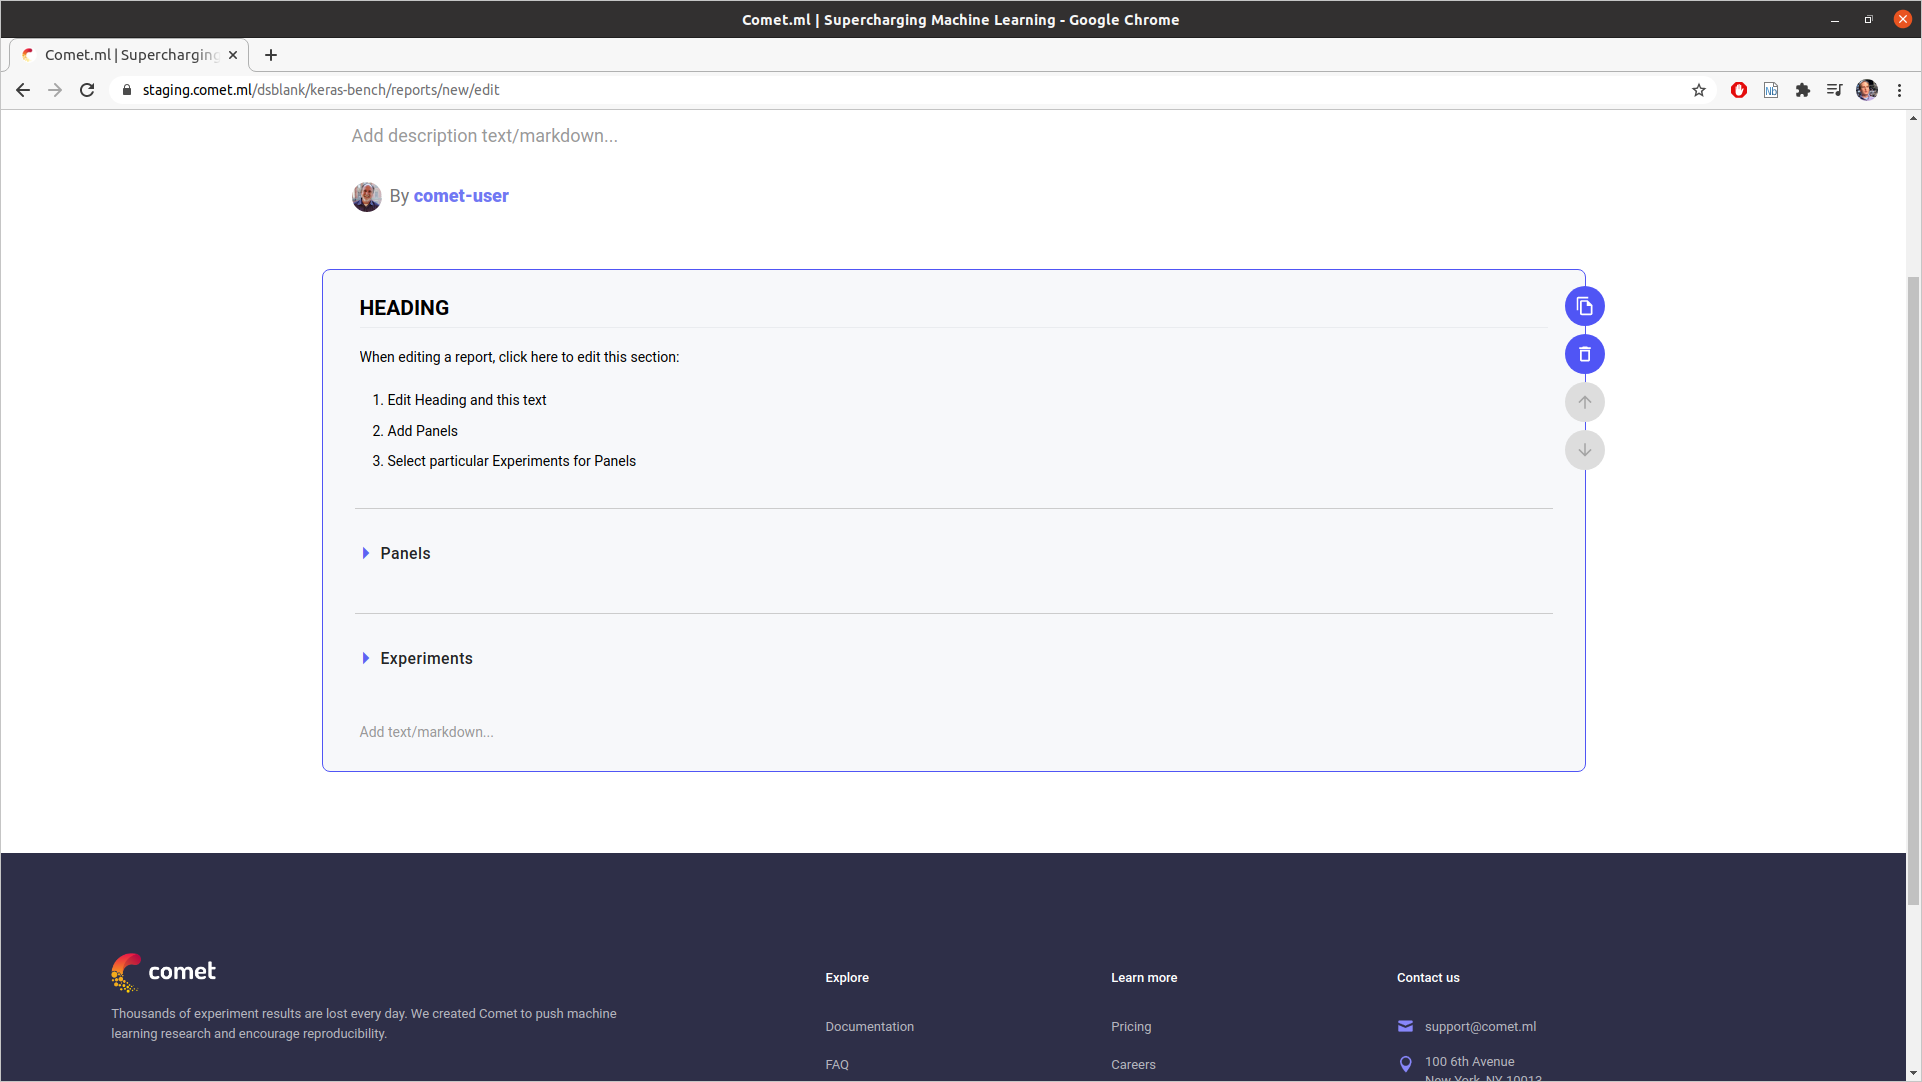
Here is a view of a Section with the Panels and Experiments collapsed:
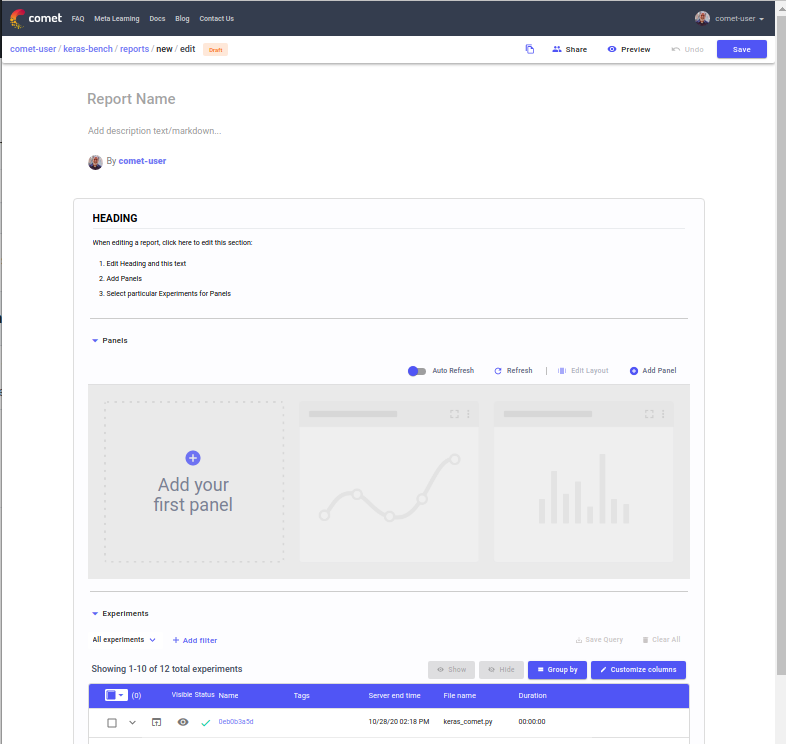
And, here is a view of a Section with the Panels and Experiments expanded:
The workflow is generally suggested as:
- Select the experiment or experiments in the Experiment Table that you wish to highlight
- Select the Panels that you wish to analyze
- Write descriptive text, code, and mathematical equations in the markdown
In each section, you can decide to hide the Experiment table by simply collapsing it in the editor.
Markdown
The Markdown areas, you can add:
- Lists
- Tables
- HTML
- Images
- Links
In addition, you can use "code blocks": syntax highlighting and coloring areas that are separated by threee backticks starting a new line, and ending with three backticks starting on a newline. These code blocks can contain Python, R, shell, or any number of these supported languages
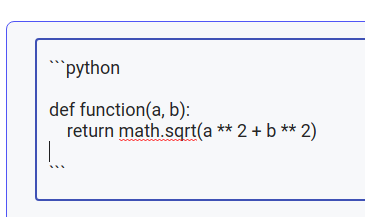
For example, to format the code in, say, Python, list the name of the language after the initial three backticks:
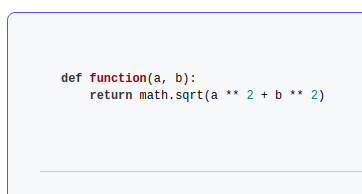
Then, it will be color highlighted like so:
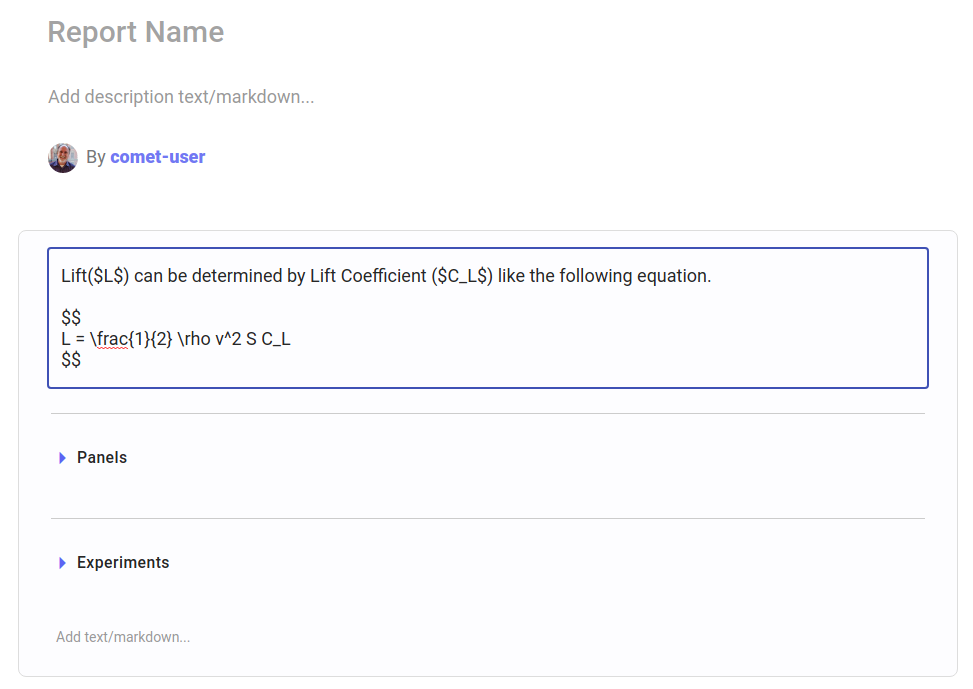
In addition, you can use LaTeX equations such that:
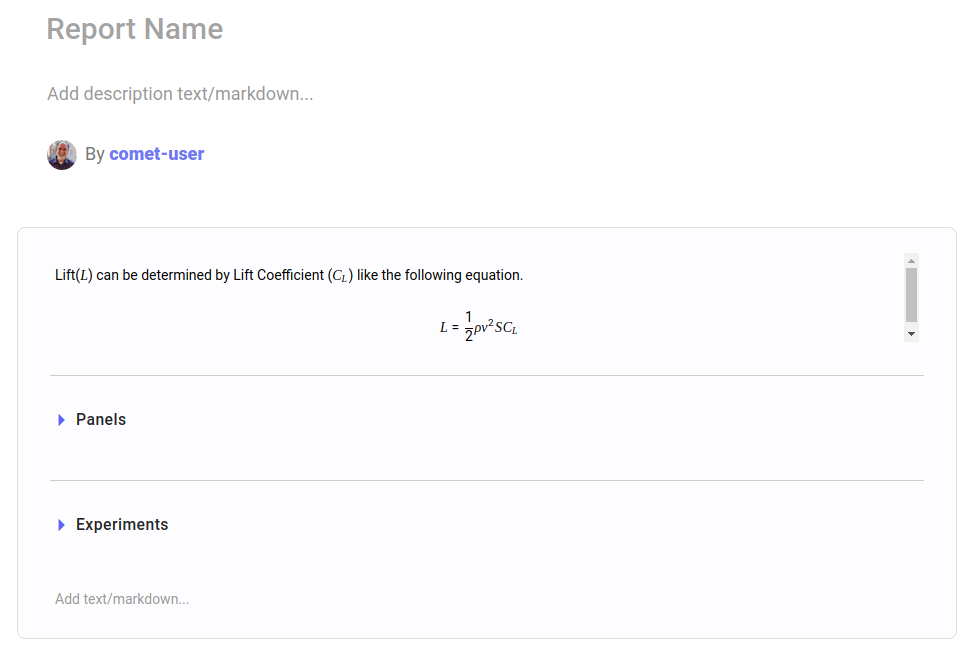
will be rendered like:
Additional Sections
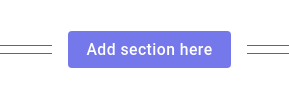
To add additional sections (either above, or below), simply edit a Report, move your mouse above (or below) an existing section, and click "Add section here":
Report Options
When view a report, you have the following options:
- Download
- Edit
- Duplicate
- Share

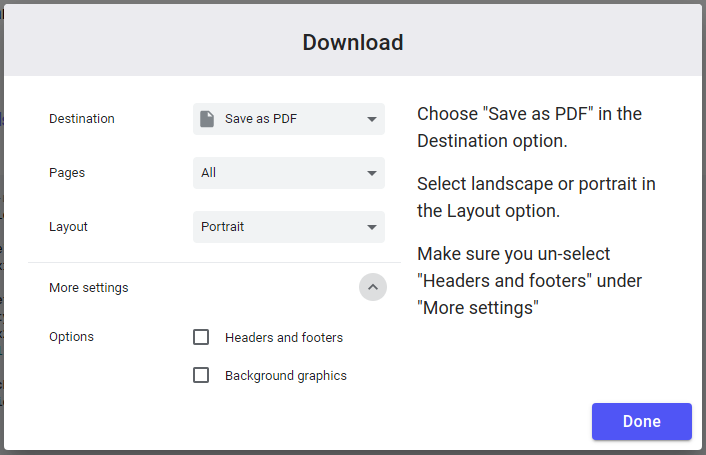
When downloading a report, you have the following choices:
Report Lists
When you are done editing a report, simply save it. It will then appear in the list of Reports for this Project.
See Also
For additional help, please see the following links: